


Clinical Data Analytics – Max Experience
Read the Magazine in PDF
The project aimed to automate data mining and transformation processes, establish standardized outcome indicators, and provide transparent data access and availability.
By - Dr Dinesh Jain
Abstract
The article discusses how Max Healthcare, a leading healthcare organization in India, used clinical data analytics to improve patient care and outcomes. The Clinical Outcome Measures project, which was implemented to monitor the quality and safety of patient care, involved identifying standardized outcome indicators, automating data mining and transformation processes, and adopting international benchmarks as comparative points. The project resulted in a significant change within the organization, with numerous parameters being monitored and all data maintained on the system. The implementation of automation as an enabler helped reduce manual errors and time consumption while making the auditing and validating process easier.
Introduction
Max Healthcare comprises 17 facilities, primarily situated in the Northern and Western regions of India. The Clinical Data Analytics department has been operational for around 6 to 7 years and has progressively advanced from simple to
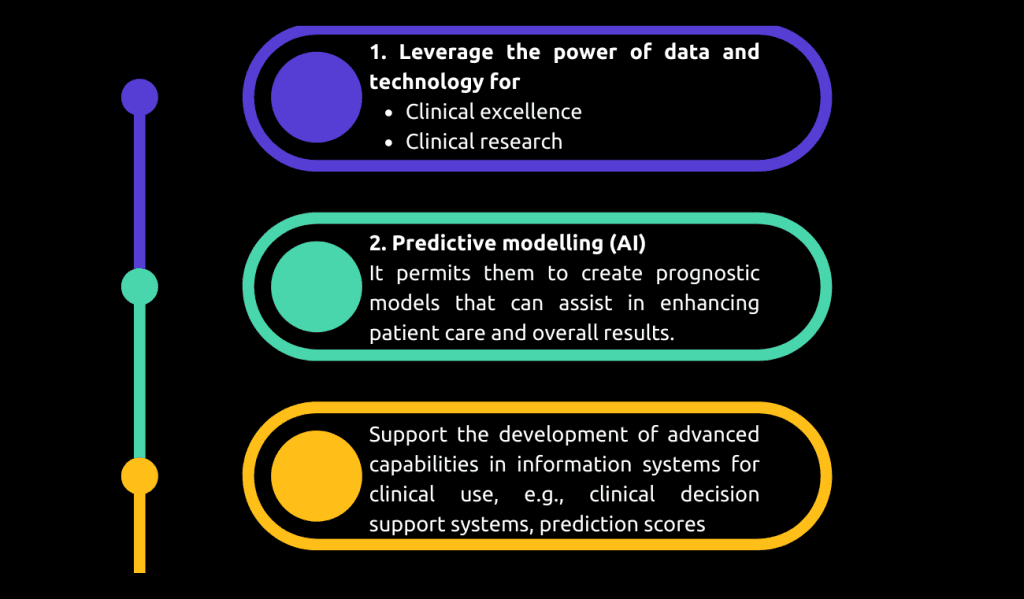
What can Data Analytics do for you?
An automated alert is generated when there is a potential drug interaction. CIMS software is integrated with clinical decision support systems and medical administration, creating a complete system. Each drug must have a barcode. Your Medical Artificial Intelligence, which is the CIMS, must be easily accessible. To prevent the administration of toxic drugs, you require a clinical decision support system that checks the laboratory results, such as a patient’s creatinine level, and alerts if the drug is not safe to administer based on the CIMS software.
Smart Critical Care
It is important to recognize that nurses are professionals and not just transcriptionists. Overburdening them with documentation tasks can result in less time for patient care and ultimately lead to problems. Therefore, it is necessary to avoid using nurses for excessive documentation tasks.
In the ICU, various devices such as ventilators, syringe pumps, and monitors are integrated with a real-time monitoring system. This enables immediate alerts to be sent and eliminates any delays, ensuring that no time is lost.
ICCA Overview
This system collects and analyzes all data points in K, providing useful information that can be acted upon and allowing for informed decision-making.
Project – Clinical Outcome Measures: A Case Study
Clinical outcome measures: why do we need them?
As per JCI 6th Edition, SQE. 11
A continuous, standardized procedure is utilized by the hospital to assess the quality and safety of patient care delivered by every medical staff member.
- Monitoring of clinical outcomes through objective measures
- Regular measurement of clinical performance -Hospital, Department, Clinicians
- Early identification of areas for clinical improvement
- The requirements from Accreditation bodies
It enhances and facilitates the adoption of quality measures as well as assists in identifying weak areas where there is room for improvement. This was the process that Max Hospital and many other hospitals used to measure outcomes in critical care.
Quality and safety parameters, as well as other metrics, were evaluated manually and recorded on paper for documentation. However, this method was labour-intensive and could result in issues with data quality and auditing. Following the completion of the project, the current state shows a transformation in the quality and safety parameters being tracked. Numerous parameters are now monitored, and the system is automated to eliminate any manual intervention in data collection, analysis, and auditing. All data is now maintained exclusively on the system, resulting in a significant change within the organization.
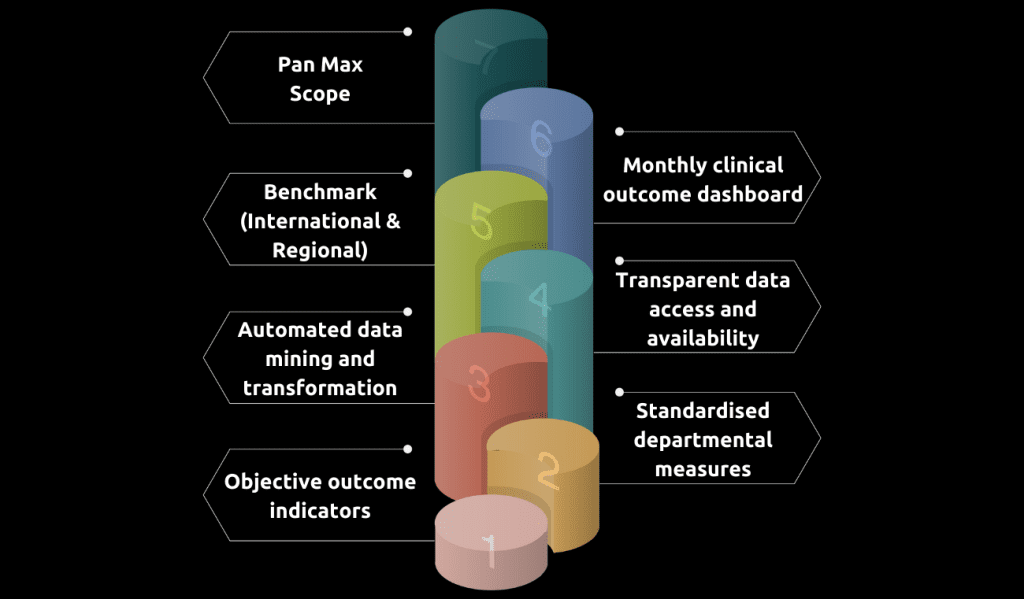
Guiding Framework for the Introduction of Clinical Outcome Measures
The primary objective of the project was to identify standardized outcome indicators and automate the data mining and transformation processes, leading to transparent data access and availability. The project also involved adopting international benchmarks as comparative points and regularly generating outcome dashboards on a monthly or quarterly basis throughout the organization.
To begin the project, the hospital collaborated with clinical department heads to select relevant clinical outcome parameters for each department.
Benchmarks were established, references were identified, and in-house software was developed to extract data from the electronic medical record system. This resulted in a reduction in manual labour and a decrease in errors that were previously inherent in the process.
A large-scale data analysis and validation exercise was conducted to verify the system and algorithm. The system was capable of being sliced and filtered at multiple levels, yielding heartwarming results. Specifically, 78% of outcome measures met or exceeded the identified Western-plus benchmarks.
Automation as an Enabler
Previously, a limited set of outcome parameters consisting of only 18 parameters were tracked manually. However, after the implementation of the project, almost 60 parameters, including both departmental and individual clinical levels, are now being tracked in real time through a live dashboard accessible to all end-users. The manual data selection process was prone to high errors and required significant time to detect and correct them. However, with the new system in place, the error rate has significantly reduced to almost zero, and the time consumed in running the system has also reduced considerably. The auditing and validating process, which was once challenging, has become easier with the entire dataset available for every end-user to check and validate. The in-house development of this innovation has helped create a role model within the organization where information systems and processes work together to improve clinical processes.
It is evident that for each clinical department, two indicators were utilized. In the case of internal medicine, three indicators were implemented.
The ICU transfer rate is a metric used to determine the rate of patients who were initially admitted to non-critical areas and later transferred to critical departments. This metric is monitored and compared to the international standard benchmark of 3.7%, which was obtained from published data on best-in-class hospitals worldwide. This enabled them to track and compare their performance against established benchmarks used by leading hospitals around the world
The Department of Internal Medicine tracks other indicators, such as the 30-day all-cause readmission rates for pneumonia and UTI. The Critical Care department, on the other hand, uses a standardized process for tracking the 14-day critical care return rate across all hospitals and departments without any manual intervention.
Dashboard
The dashboard provided them with immediate access to the values of all the parameters, including the numerator, denominator, and resulting ratios.
Milestones in this journey
- The hospital’s programs decreased in complexity as they progressed.
- Began with a small program for accessing a clinical decision support system.
- The program was used to identify moderate and severe risk patients and institute a prophylactic program for them.
- Gradually progress to a healthcare-acquired infection surveillance program.
- Manually processed suspicious cases using infection control nurses and doctors.
- Implementation of an antimicrobial stewardship program and tracking a drug resistance index.
- Development of an acute Myocardial infarction 30-day admission risk model.
- Development of a predictive model for estimating the length of stay for dengue patients.
- The project demonstrated the hospital’s progress in adopting new processes and transforming its workforce.
- As their confidence grew, they undertook projects that were more intricate.
Conclusion
Max Healthcare has 17 facilities in India, and its Clinical Data Analytics department has been operational for 6-7 years. The department has progressed from simple to intricate projects, and a case study was presented on its latest project, which involved identifying standardized outcome indicators and automating the data mining and transformation process for clinical outcome measures. This led to a significant change within the organization, as numerous parameters are now monitored and the system is automated to eliminate any manual intervention in data collection, analysis, and auditing. The system was capable of being sliced and filtered at multiple levels, and 78% of outcome measures met or exceeded Western-plus benchmarks.